Examples Gallery
This gallery shows many examples of figures that can be rendered using Plantweb. All these examples were taken from the website of each project.
You can check the source code of this page.
For the original source of this examples or for more information and examples please visit the website of each project as shown in each section.
This section can be seen as a display of capabilities of the individual projects, but it is mostly a medium to test Plantweb Sphinx directives.
PlantUML
PlantUML is a component that allows to quickly write many UML diagrams using a simple and intuitive language.
For more examples and information visit the official website:
Sequence
A Sequence diagram is an interaction diagram that shows how objects operate with one another and in what order.
- Wikipedia, “Sequence Diagram”.
For detailed explanation see:


Use Case
A use case diagram at its simplest is a representation of a user’s interaction with the system that shows the relationship between the user and the different use cases in which the user is involved.
- Wikipedia, “Use Case Diagram”.
For detailed explanation see:


Class
A class diagram is a type of static structure diagram that describes the structure of a system by showing the system’s classes, their attributes, operations (or methods), and the relationships among objects.
- Wikipedia, “Use Class Diagram”.
For detailed explanation see:


Activity
Activity diagrams are graphical representations of workflows of stepwise activities and actions with support for choice, iteration and concurrency. In the Unified Modeling Language, activity diagrams are intended to model both computational and organizational processes (i.e. workflows). Activity diagrams show the overall flow of control.
- Wikipedia, “Use Activity Diagram”.
For detailed explanation see:


Component
A component diagram depicts how components are wired together to form larger components and or software systems. They are used to illustrate the structure of arbitrarily complex systems.
- Wikipedia, “Component Diagram”.
For detailed explanation see:


State
A state diagram, also called a state machine diagram or statechart diagram, is an illustration of the states an object can attain as well as the transitions between those states.
- TechTarget, “State Diagram”.
For detailed explanation see:


Object
An object diagram is a graph of instances, including objects and data values. A static object diagram is an instance of a class diagram; it shows a snapshot of the detailed state of a system at a point in time. The use of object diagrams is fairly limited, namely to show examples of data structure.
- Object Management Group (2001), “UML specification 1.4”.

Graphviz
Graphviz is open source graph visualization software. Graph visualization is a way of representing structural information as diagrams of abstract graphs and networks.
It has important applications in networking, bioinformatics, software engineering, database and web design, machine learning, and in visual interfaces for other technical domains.
For more examples and information visit the official website:
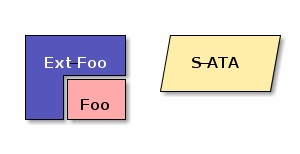
Cluster
This small example illustrates dot’s feature to draw nodes and edges in clusters or separate rectangular layout regions. Clusters are encoded as subgraphs whose names have the prefix ‘cluster’. The color attribute of a cluster is interpreted as its outline color or its background color if its style is ‘filled’. Mdiamond and Msquare are modified symbols for data flow diagrams.

Data Structures
The graph file was generated automatically from a session with the LDBX graphical interface to the standard DBX debugger.
Nodes are drawn with the
'record'shape. Labels of this shape are interpreted specially as nested horizontal and vertical box lists formatted as tables. In a record label, curly braces{ }enclose lists, vertical bar|separates list items, and creates a port identifier for attaching edges. Edges are also labeled with'id'attributes. Though not demonstrated in this particular file, these attributes allow referencing multiple (parallel) edges between the same node pair.

Finite Automaton
This is a drawing of a finite automaton. The rankdir and orientation request a left-to-right drawing in landscape mode. Note the use of text labels on edges.